Graphing

Counting Book Graph

Today’s math skill is going to incorporate number sense, by counting and writing the numeral that represents the group of objects, in a mommy/daddy teacher-made graph.  Whew! That was a mouthful, but this it is because this activity is packed with opportunities for extensions and repetition.

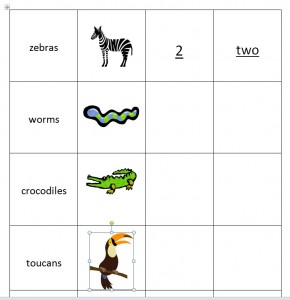
YOU are going to look through a counting book (or other family favorite book with pictures) and then fill in the first two columns of a graph with the animal/object names and images for your little one to search through the book to find and count.   My example is below from the book “Count!”, but you can free-hand the image….it doesn’t have to be perfect.  Your goal is to give your little one a researching task that causes them to find, count, and write the information into the correct spaces on the graph.  You will be there, by their side, helping with this task.  Your little one doesn’t have to sound out the number word in order to write it….he/she can use their book resource to write the numbers and spell the number words.

This is a great counting book extension to give your little one an independent activity to do and to learn from.

Snack Graph

My husband didn’t eat many “Sugar cereals” (as he calls them) when he was a kid. I, on the other hand, ate cinnamon toast crunch, reese’s puffs, fruit loops, and all the tasty stuff on the cereal aisle. So when I brought home “Fruity Cheerios” the other day my husband had a skeptical look on his face when he said “these taste like fruit loops.” So I respond, “Yeah, they’re great right?” And he responded with a comment about it being a sugar cereal, but I disagreed and I still claim that its Cheerios so it can’t be that bad for you.

Anyway, all that to say, in my Kindergarten class I LOVED to graph colorful snacks like fruit loops, gummy bears, colorful goldfish, etc.
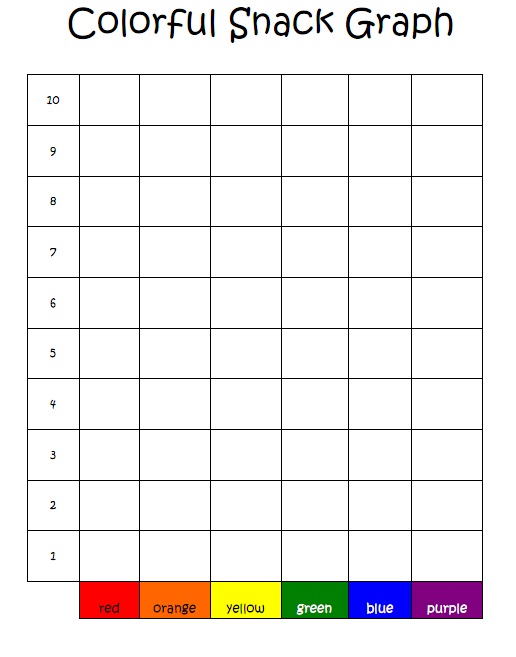
So, I made a graph for you so that you can graph your colorful snack, whatever it may be, at home!

Colorful Snack Graph

All you will do is ask your child to take their serving of their snack and see if they can sort the colors into the right columns that line up above the color name. Then, when all the pieces are in place, you can ask your little one some of the following questions…. but some of them might be inappropriate for their level of understanding “number sense” – so dont push it:
– Which color of your snack did you have the most of? How many are there of that color?
– Which color of your snack did you have the least (or the smallest amount) of?
– Were there any colors that had the same/equal amount of that color snack?
– Which colors have more than 5? Less than 10?

The point is to teach your little one how to use and analyze a graph. This is a learning experience for YOU and your little one. You should feel proud of yourself for attempting this because you are introducing your little one to an activity that causes him/her to use higher order thinking skills to navigate his way around this visual data chart that he assembled….pretty advanced for such a young mind huh?

Related Posts Plugin for WordPress, Blogger...